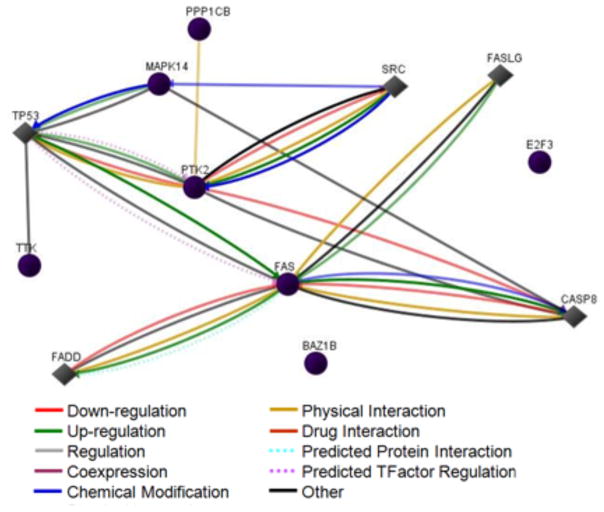
Figure 6. Network analysis of noise-induced proteomic changes in sensory epithelium.
Network analysis by SABiosciences GNCPro software indicated that most of the proteins that changed in the sensory epithelium were involved in a network that also included Src and suggested that these proteins had biochemical as well as physical interactions. Circles represent the originally analyzed proteins while diamonds represent those that were added to the network during a one step expansion. Gene symbols are used to indicate the proteins.

