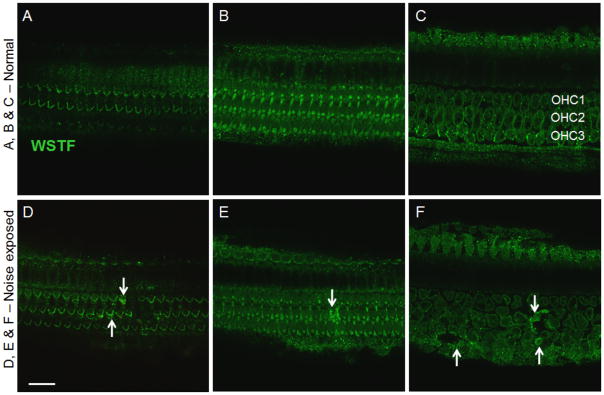
Figure 9. Immunolocalization of WSTF in the organ of Corti.
Panels A, B and C show a normal cochlear section. D, E and F show a section displaying noise induced hair cell damage. Confocal images at the level of stereocilia (A and D) illustrates that stereocilia adjacent to the noise damaged region (D) indicated by arrows show strong signals (Green). Images at the level of cuticular plate (B and E) and the body of OHC (C and F) also indicate a similar pattern displaying increased WSTF immunoreactivity (shown by arrows) in regions adjoining the noise damaged cells. Bar = 20 μm.

