
Figure 5. Changes in dopamine neuron activity in response to OFC stimulation.
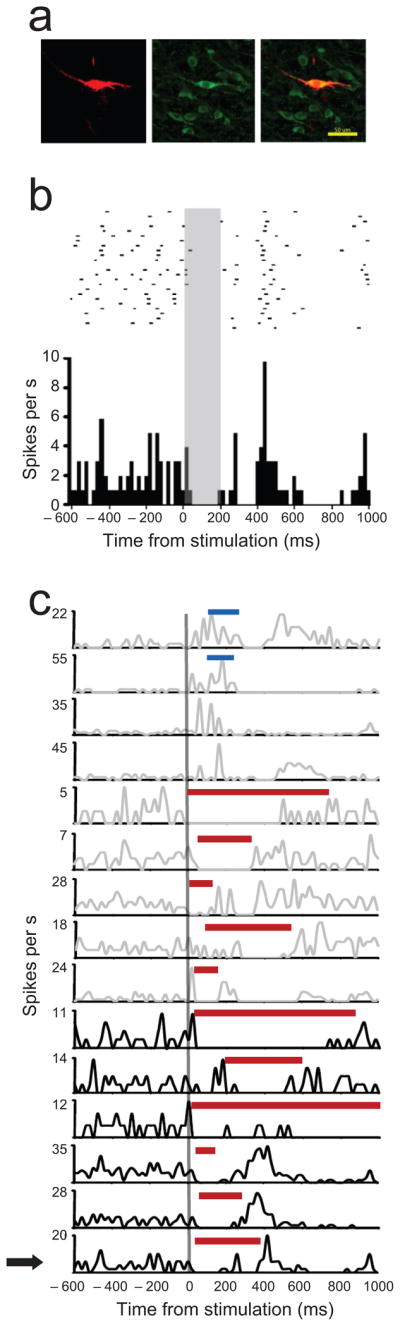
(a) An example of putative dopamine neuron labeled with Neurobiotin (left, red) and TH (middle, green). This neuron had morphological characteristics of dopamine neurons (bipolar dendritic orientations) and showed co-localization of Neurobiotin and TH (right, merged). Scale bar=50 μm. (b) Raster plot and peri-stimulus histogram showing activity in the TH+ neuron in (a) before, during and after OFC stimulation. Top: each line represents a trial and dots indicate time of action potential firing; grey box indicates period of OFC stimulation. Bottom: cumulative histogram depicting firing across all trials and revealing a pause during the stimulation. (c) Firing rate plots showing activity in each of the 15 recorded neurons before, during and after OFC stimulation. Arrow indicates raster of neuron shown in (a, b). Each line shows the average firing rate per stimulation trial for a given neuron. Activity is aligned to onset of OFC stimulation. The vertical grey line indicates the onset of OFC stimulation. Thirteen neurons showed periods of significant inhibition (red bars) or excitation (blue bars) that began during the stimulation. Excluding secondary or rebound excitation or inhibition evident in the figure, these neurons did not exhibit significant epochs elsewhere in the inter-stimulus interval (not shown). Grey rate plots, putative dopamine neurons; black rate plots, TH immunopositive neurons.