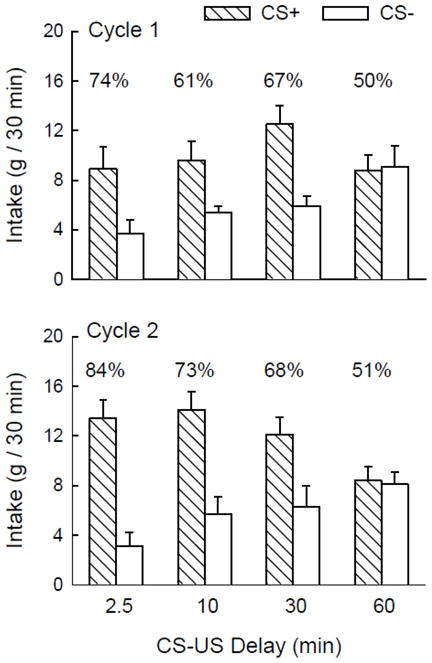
Figure 1.

Mean (+SEM) intakes of CS+ and CS− solutions by the 2.5-, 10-, 30- and 60-min groups during two-bottle testing in cycles 1 (top panel) and 2 (bottom panel) of Experiment 1. The group names refer to the delay between CS intake and 8% glucose US infusion in training sessions. Numbers atop the columns indicate the percentage preference for the CS+ solution.
