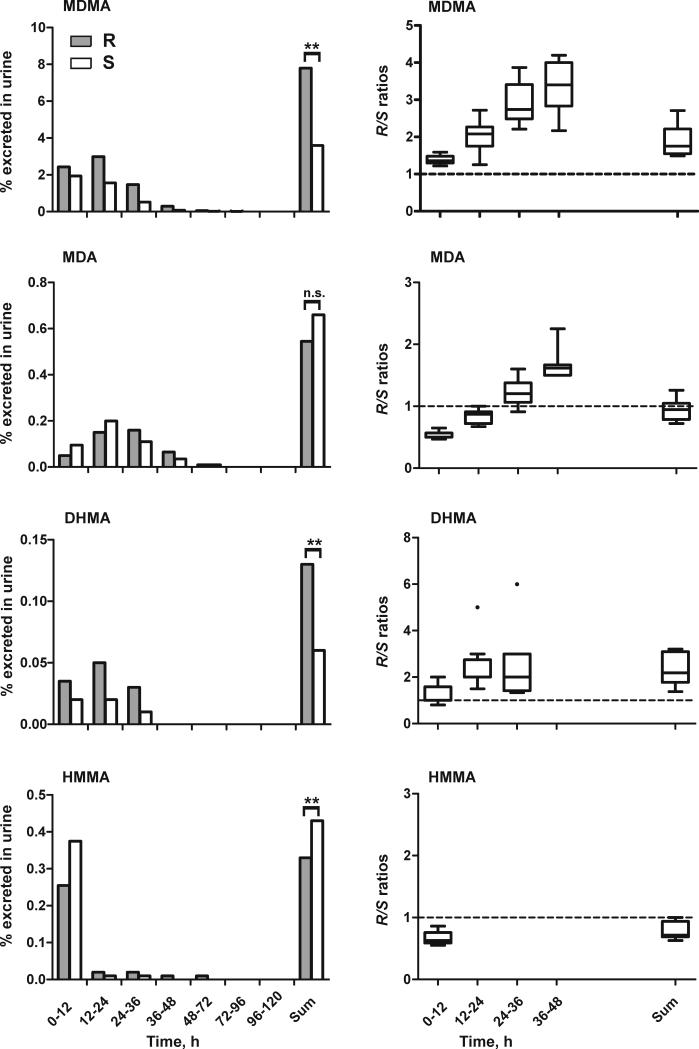
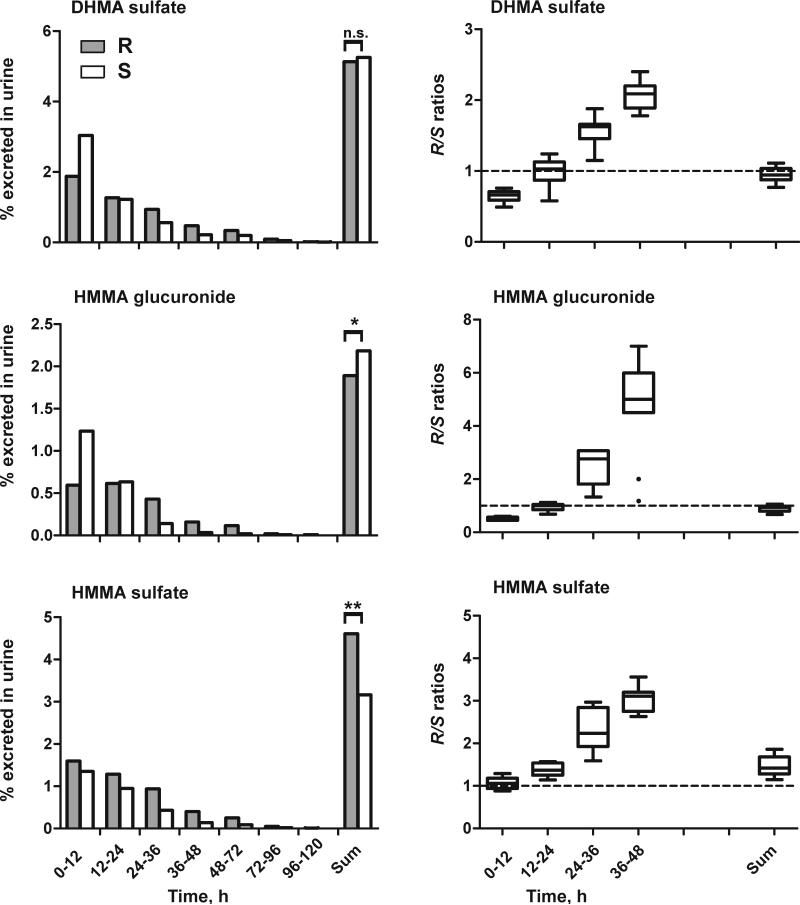
Fig. 2.
Median percent dose excreted as R- (grey bars) or S- (white bars) stereoisomer for different time intervals (each 12 h) and total dose excreted in urine over 5 days following the high (1.6 mg/kg) MDMA dose (left). Statistical analysis was performed with a paired, two-tailed t-test with p<0.05 (*), p<0.01 (**), p<0.001 (***). R/S ratios for different time intervals (each 12 h) or over 5 days following the high (1.6 mg/kg) MDMA dose (right). The broken line represents equal amounts of R- and S-isomers.


