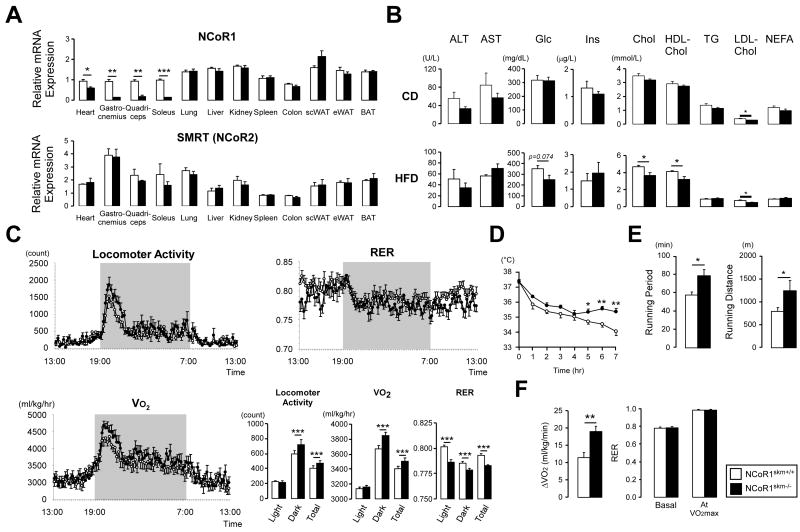
Figure 1. Validation and metabolic phenotypes of NCoR1skm-/- mice.
(A) mRNA levels of NCoR1 and Smrt in different tissues were determined by qRT-PCR. Values were normalized to 36B4. (n=8-10/group). (B) Biochemical analysis of the plasma from NCoR1skm+/+ and skm-/- mice after 6 hr fasting (n=8) either on chow diet (CD) (top) or HFD (bottom). (C) Circadian activity, measured as the total locomotor activity, and energy expenditure was evaluated by the measurement of oxygen consumption (VO2), and by the calculation of the respiratory exchange ratio (RER) over a 24 hr period after 12 wks of HFD. The bar graphs represent the average for each group (n = 12). (D) Body temperature was measured for 7 hr in mice exposed to 4°C after 18-wks of HFD (n=7, 8). (E and F) Exercise experiments, measuring running time and distance till exhaustion (endurance exercise) (E) and the increment of VO2max, during exercise, and RER levels at basal and VO2max condition (F) were performed after 14- and 17-wk HFD.
Data are expressed as mean ± SEM.
See also Suppl. Figs. 1-3 and Suppl. Tables 1-3.

