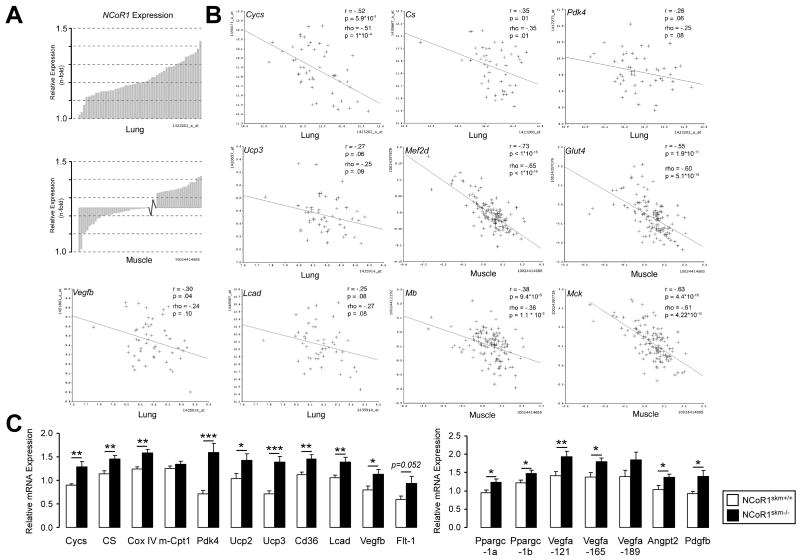
Figure 4. Identification of NcoR1-correlated genes.
(A) Expression of NCoR1 mRNA in lung tissue of the different BXD strains (upper) and in muscle tissue from an F2 intercross between C57BL/6J and C3H/HeJ (lower panel). Natural expression variation across the animals is ∼1.5 fold in each tissue. (B) Pearson's r and Spearman's rank correlation coefficient, rho, were calculated with corresponding p values for the mRNA covariation between NCoR1 and genes involved in oxidative phosphorylation (Cycs, Cs, and Pdk4), mitochondrial uncoupling (Ucp3), fatty acid metabolism (Lcad), angiogenesis (Vegfb), glucose uptake (Glut4), and myogenesis (Mef2d, Mb, Mck). The tissue from which data were generated is indicated. (C) Gene expression analysis by qRT-PCR in NCoR1skm+/+ and skm-/- gastrocnemius (n=10).
Data are expressed as mean ± SEM.See also Suppl. Fig. 5 and Suppl. Tables 3-5.

