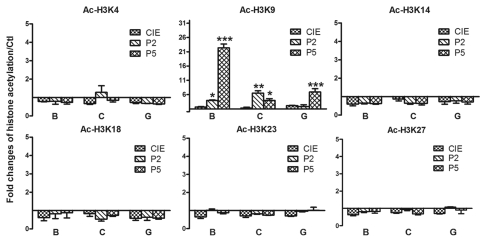
Figure 4.
Ethanol-induced selective histone H3K9 acetylation. Multiple qChIP assays were performed to examine the acetylation levels of the indicated residues of histone H3 in Areas B, C and G in the 5′ regulatory region of the NR2B, respectively. Specific antibodies (see Methods) used are indicated in each sub-graph. Data shown are the representatives of three separate experiments. Values are presented as means ± SEM and represent the fold change over their corresponding controls (control = 1). *p < 0.05, **p < 0.01 and ***p < 0.001, two-way MANOVA followed by Newman-Keuls post hoc comparison.

