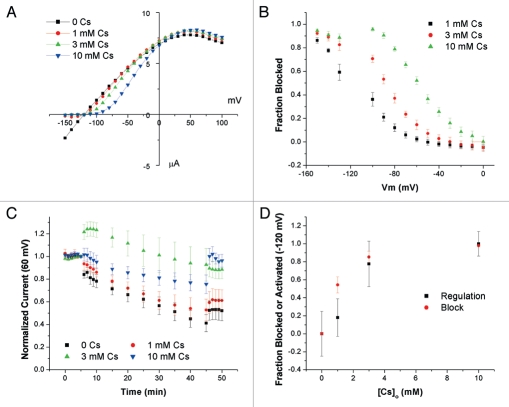
Figure 6.
Comparing Cs+ block and regulation occur at similar concentrations. (A) Representative I–V relationships at different [Cs+]o. [K+]o was constant at 1 mM K+. (B) Summary of Cs+ block experiments. Fractional block was computed as 1 − I(Cs)/I(0), where I(Cs) and I(0) are the currents in the presence and absence of Cs+, respectively. (C) Time course of whole-cell currents of oocytes preincubated in 110 mM K+ and switched to solutions containing 1 mM K+, 109 Na+ and indicated [Cs+]o at t = 6 min. Currents are normalized to values at t = 5 min. The membrane voltage was clamped at −120 mV between t = 6 and t = 45 min (n = 4–6). (D) Summary plot Concentration dependence of regulation and block. Data for regulation are taken at t = 46 min and set to be 0 at 0 [Cs+]o and 1 at 10 mM [Cs+]o. Data for block are interpolated values for −120 mV.

