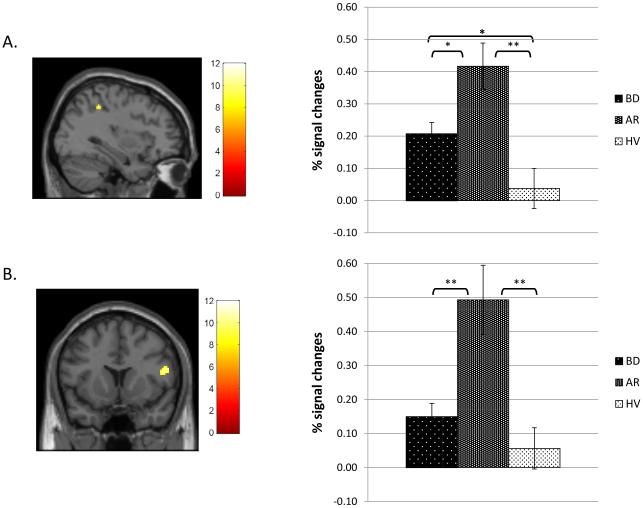
Figure 2.
Brain areas showing between-group differences on the successful change vs successful go contrast among bipolar disorder (BD), at risk (AR), and healthy volunteer (HV) groups. Color bars represent F values of the contrast. All clusters were determined at the significance threshold of p < .001 (uncorrected), voxel ≥ 10. Percent signal change estimates for each contrast were averaged across the entire cluster for each participant. Post-hoc Bonferroni-corrected analyses were performed to decompose between-group differences at a statistical threshold of p < .05.
A. right inferior parietal lobe (BA40; 36, −42, 46); B. right ventrolateral prefrontal cortex (BA44; 52, 12, 18). **p<.001, *p<.05.

