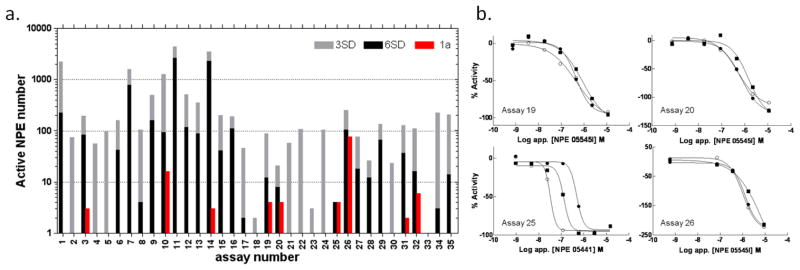
Figure 1. Activity analysis of NPEs in various assays.
a. Bar chart summarizing active NPEs in assays ordered by format (1–15 are fluorogenic; 16–18 are fluorescent polarization; 19–30 are bioluminescent; 31–32 ALPHA based chemluminescent; 33–34 use fluorescent protein expression and 35 is an absorbance output). The number of active NPEs per assay are indicated on the y-axis, where red represents a class 1a CRC (as previously defined [11]), while 3SD and 6SD cutoffs for activity at a single apparent concentration of 10 μM are given by the grey and black bars. b. Plots showing qHTS class 1a CRC results from assays selected for further analysis (see also Figure S2b). Assays 19, 20 and 26 displayed activity from a common strain, NPE 05545. Additional assay details can be found Table S1

