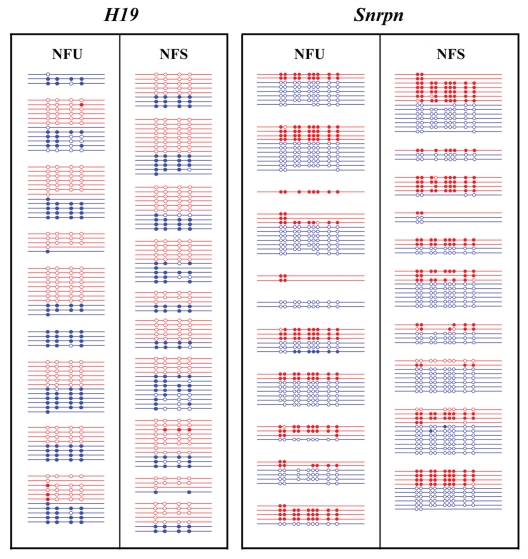
Figure 5.
Methylation patterns of H19 (left side) and Snrpn (right side) in in vivo produced mouse (M. musculus x M. musculus castaneus) 16-cell embryos from unstimulated (NFU group) versus superovulated matings (NFS group). Each line indicates an individual allele (LD product). Maternal alleles (highlighted in red) and paternal alleles (blue) from the same embryo are grouped together. Open circles represent unmethylated CpG sites and filled circles methylated CpGs.

