
Figure 1.
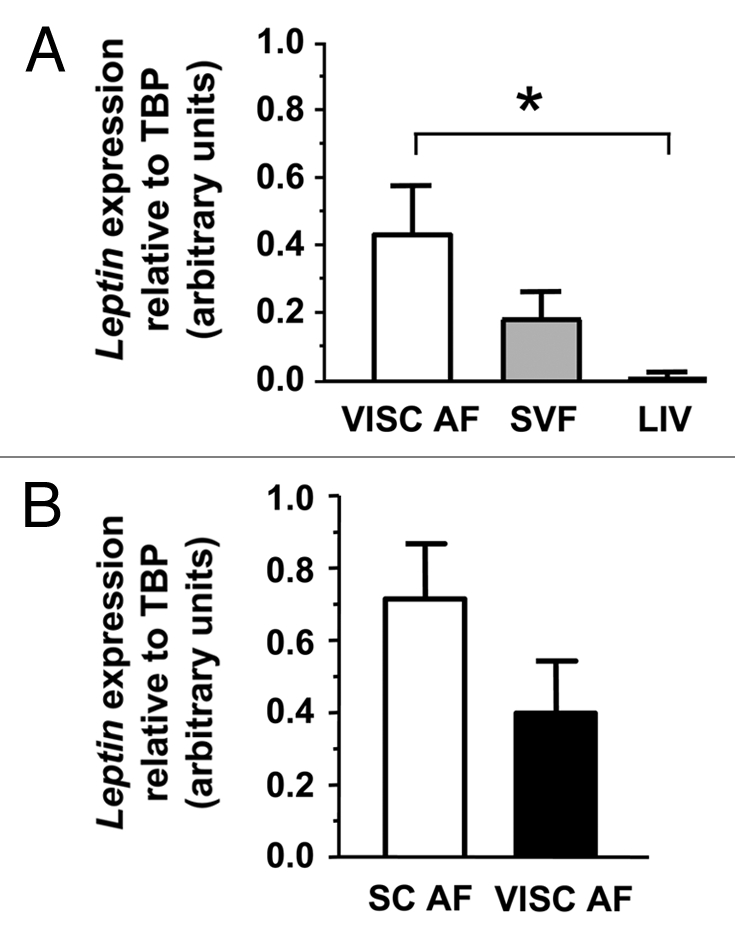
Leptin expression in different tissues. Leptin mRNA abundance (expressed in arbitrary units) in VISC AF, VISC SVF and Liver of 6 patients (A), and in SC AF versus VISC AF (n = 3) (B) quantified by Real-Time PCR and normalized against that of Tata Binding Protein (TBP). SE, error bars. One-way repeated measures ANOVA, post-hoc test with Bonferroni adjustment *p < 0.05.