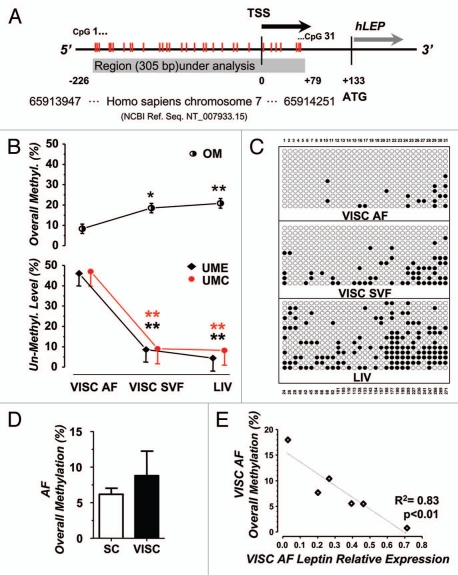
Figure 2.
Methylation density in LEP promoter region. (A) Schematization of the 3′ LEP promoter region we investigated, which spans from −279 to +79 respect to the Transcription Start Site (TSS) for a total length of 305 bp. Initiation of translation is also indicated. Red vertical lines represents the 31 CpGs identified. Region localization on human Chromosome 7 is reported, as annotated in the NCBI genebank database. (B and C) Cumulative analysis of the methylation frequency in AF, SVF and liver from human biopsies (n = 6). (B) Quantification of the Overall Methylation, OM (upper panel), UME and UMC (lower panel) for each kind of tissue, statistically adjusted for the number of epialleles analyzed. One-way ANCOVA; post-hoc test with Bonferroni adjustment: AF vs. SVF and AF vs. LIV, *p < 0.05, **p < 0.01; (C) Representative methylation pattern for each tissue of one patient. Epialleles are displayed in rows; CpG positions are displayed in columns (progressive numbering at the top, base-pair localization at the bottom). Black dots: methylated CpGs; white dots: un-methylated CpGs. (D) Quantification of the Overall Methylation in AF from SC and VISC WAT (n = 3). (E) Leptin expression is inversely correlated to the overall methylation in VISC adipocytes from 6 obese patients (R2 = 0.83, p < 0.01).

