
Figure 1.
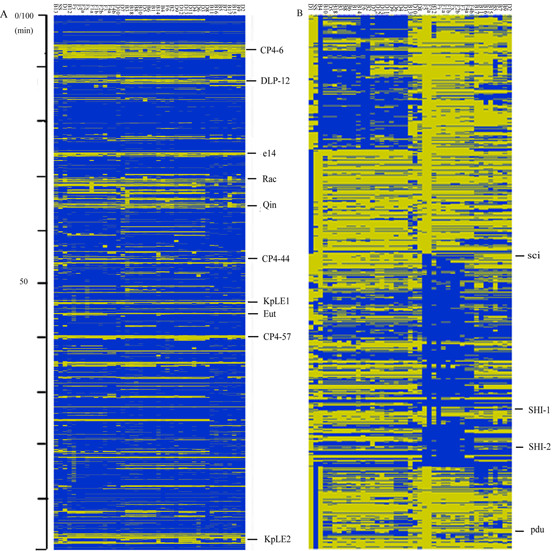
Genome composition analysis. Each row corresponds to a specific spot on the array, whereas columns represent strains analyzed and are labelled according to the designations in Table 1. The ORFs status is color-coded: blue, present/conserved; yellow, absent/divergent. (A) The E. coli dataset. (B) The Shigella ORFs which were not present in MG1655. The region of the Shigella ORFs which were not present in MG1655 was enlarged. Ten prophage regions in the MG1655 genome and several selected gene clusters are indicated. SHI-1 and SHI-2 are Shigella pathogenicity islands. Sci island is the possible pathogenicity island that has been found in genome Sf301. The pdu gene cluster is correlated with propanediol utilization. Strains are labelled according to the designations in Table 1.