
Figure 3.
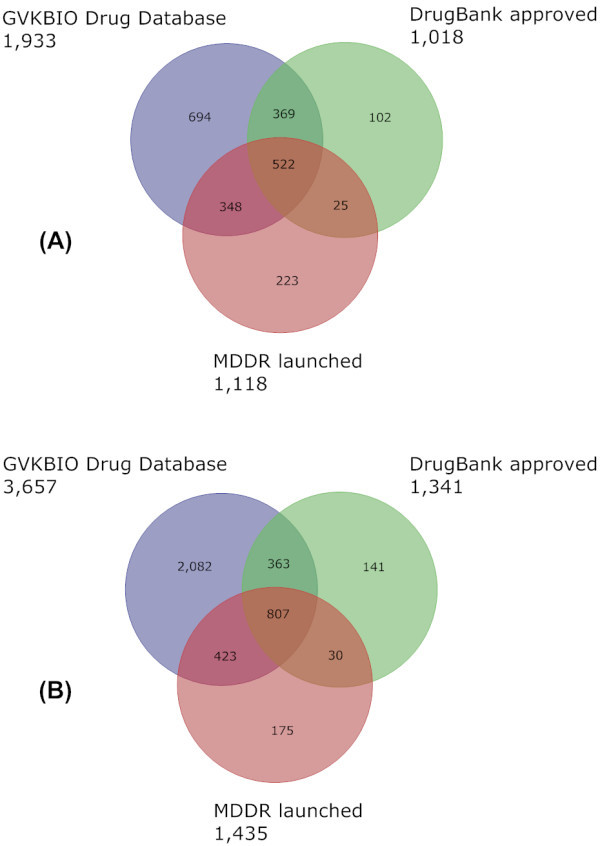
Comparison of drug databases. A Venn diagram showing the content overlap and differences between GVKBIO DD, MDDR launched and DrugBank approved. The 2006 versions are shown in (A) and 2008 from this publication in (B). The data source name and compound totals are given outside each of the three circles.