
Figure 6.
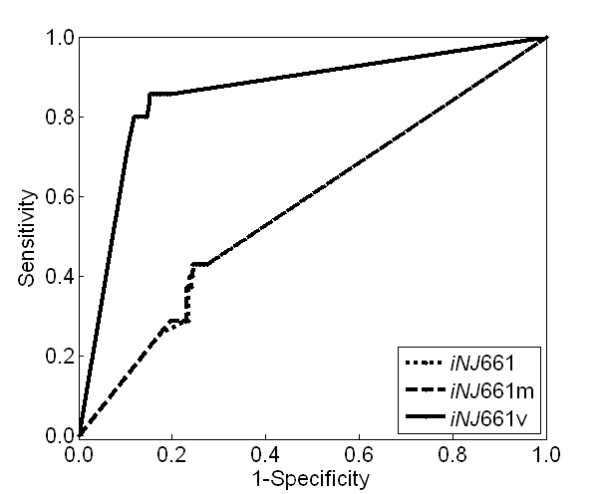
Receiver operating characteristic (ROC) curves for gene essentiality predictions of Mycobacterium tuberculosis. Sensitivity [TP/(TP + FN)] and 1 minus specificity [1 - TN/(TN + FP)] (where TP: true positive, FN: false negative, TN: true negative, and FP: false positive) were calculated as a function of the growth ratio thresholds used to determine gene essentiality in three different network models: iNJ661 (dotted curve), iNJ661m (dashed curve), and iNJ661v (solid curve).