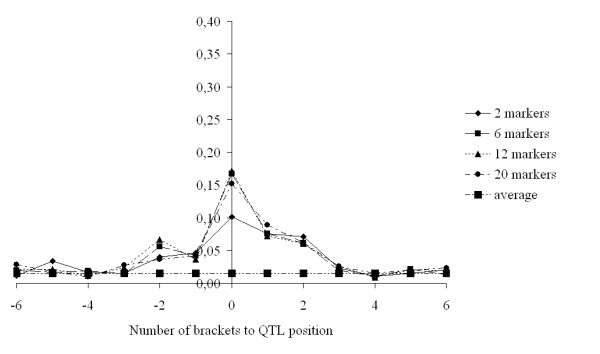
Figure 4.

Average posterior probabilities (across 80 replicates) of a fitted QTL in (neighbouring) brackets where a QTL was simulated with a variance > 0.02 σp2 and < 0.05 σp2 for clustering of base haplotypes with a limit of 0.55, and window sizes of 2, 6, 12 and 20 markers, and on average across all brackets. On average, per replicate there were 3.21 such simulated QTL
