
Figure 4.
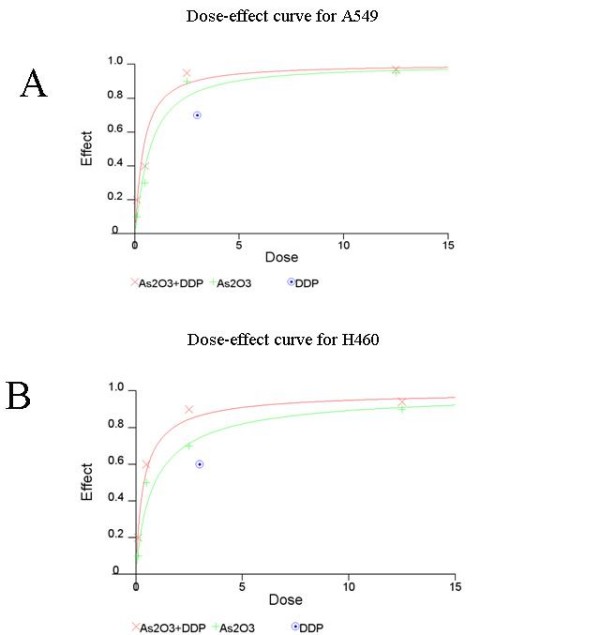
Dose effect curve for A549 (A) and H460 (B) cells. The concentration of DDP was 3 μg/ml and the concentration for As2O3 ranged from 0.1 μM to 12.5 μM. CalcuSyn™ (Version 2.0, Biosoft, Inc., UK) was used for dose-effect curves and to determine the combination indices (CI).