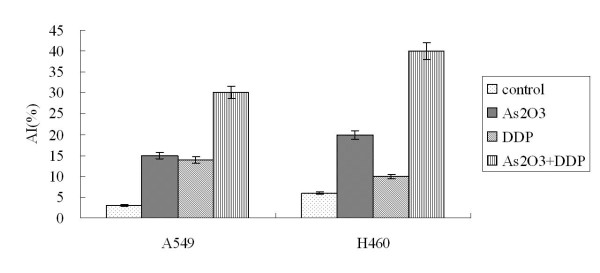
Figure 7.
TUNEL staining analysis. With TUNEL staining, the AI for the control A549 cells and cells treated with As2O3, DDP, or the combination were 3.1 ± 0.16%, 15.41 ± 0.77%, 14 ± 0.7%, and 30 ± 1.5%, respectively; the AI for the control H460 cells and cells treated with As2O3, DDP, or the combination were 5.95 ± 0.25%, 18.6 ± 1.13%, 9.53 ± 0.49%, and 40.6 ± 2.11%, respectively.

