Figure 4.

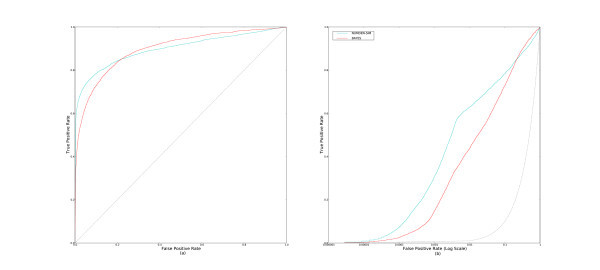
ROC and pROC curves of BAYES and NUMDEN-SIM. This figure shows the (a) ROC and (b) pROC curves for BAYES with NUMDEN-SIM included for comparison.

ROC and pROC curves of BAYES and NUMDEN-SIM. This figure shows the (a) ROC and (b) pROC curves for BAYES with NUMDEN-SIM included for comparison.