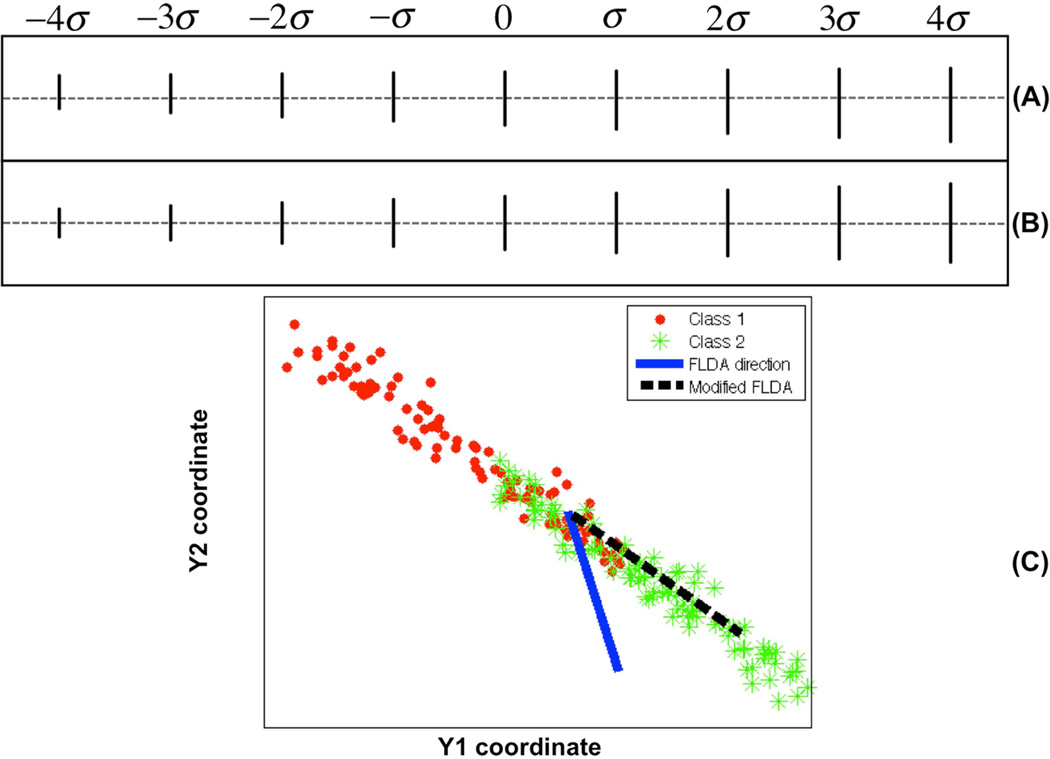
Figure 1.
Discriminant information computed for a simulated data set. A: Visualization of computed most discriminant direction by applying the standard FLDA method. B: Visualization of computed most discriminant direction by applying the penalized FLDA method. C: Plot of two sample points on the contour for the whole data set. See text for more details.

