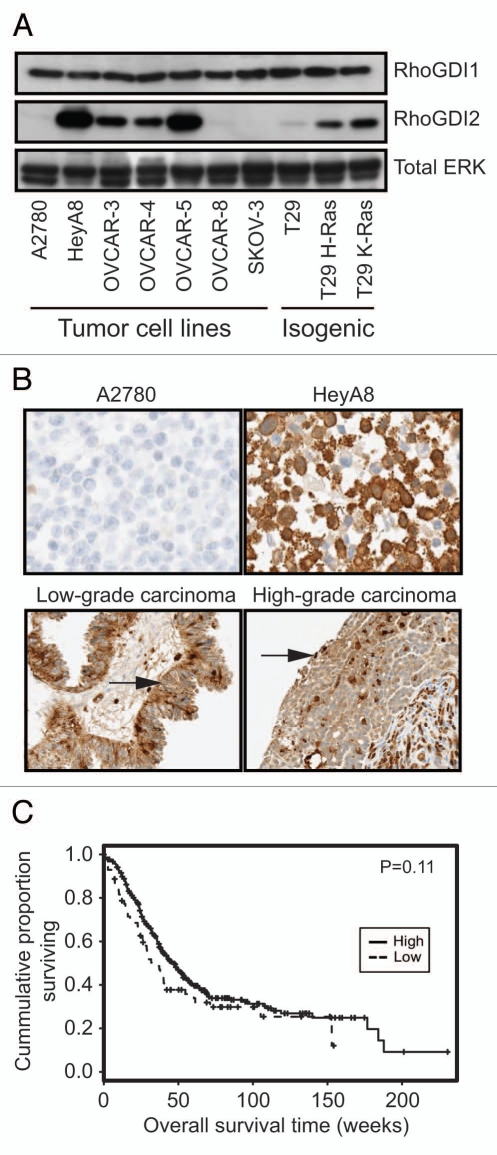
Figure 1.
Variable levels of RhoGDI2 but not RhoGDI1 protein expression in human ovarian cell lines. (A) Western blot analyses of RhoGDI1 and RhoGDI2 protein expression. Cell lysates were subjected to immunoblotting analysis using antibodies specific for RhoGDI1, RhoGDI2, or the loading control (ERK1 and ERK2). T29 is a nontransformed, immortalized human ovarian surface epithelial cell line that was then stablytransfected with expression vectors encoding activated, transforming mutant H-Ras(12V) or K-Ras(12V), and designated T29 H-Ras and T29 K-Ras, respectively. Results shown are representative of three independent experiments. (B) Validation of anti-RhoGDI2 antibody for IHC analysis. Negative (top left) and positive (top right) control paraffin-embedded ovarian cancer cell lines that express low (A2780) or high (HeyA8) levels of RhoGDI2. A borderline tumor (serous tumor of low malignant potential, bottom right) demonstrated moderate diffuse cytoplasmic staining and a high-grade serous carcinoma (bottom left) demonstrated strong but patchy staining of RhoGDI2. Arrows indicate cancer cells that stain positive for RhoGDI2. (C) IHC analysis of RhoGDI2 protein expression in ovarian cancer patient-derived tissue. Kaplan-Meier survival curves of low and high RhoGDI2 expression groups from a total number of 388 ovarian cancer patient tissues. “Low” expression groups are defined as staining intensity*percent ≤20 percent (73 samples) and “High” as staining intensity*percent > 20 percent (315 samples).

