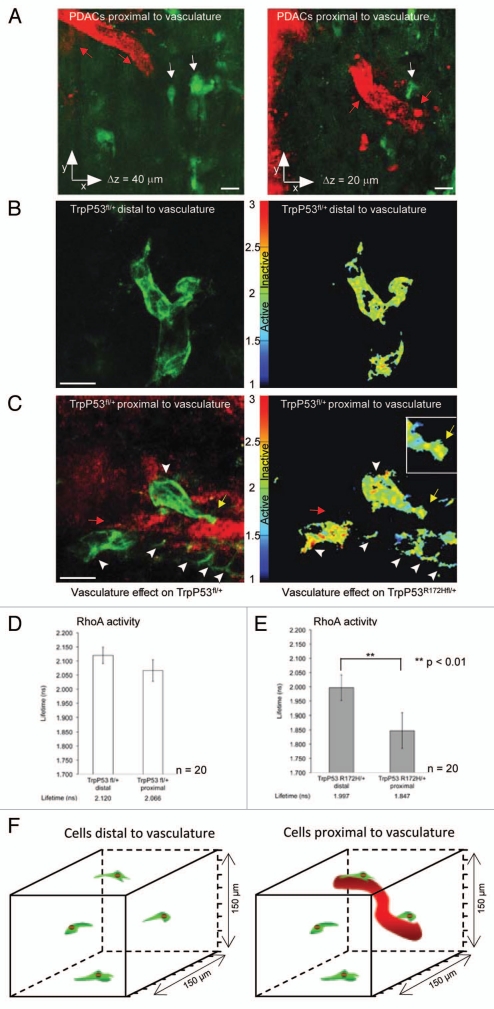
Figure 3.
Spatial regulation of RhoA activity within tumor population. (A) Representative image of cells (green) proximal to host vasculature (red). (B) p53fl PDAC cells distal to host vasculature expressing the Raichu-RhoA reporter (green) with corresponding in vivo lifetime map of RhoA activity, respectively. (C) p53fl PDAC cells expressing the Raichu-RhoA reporter (green) proximal to host vasculature (red) with corresponding in vivo lifetime map of RhoA activity, respectively. (D and E) Quantification of lifetime measurements of RhoA activity within the tumor environment. Lifetime pseudo-colors; blue represents active biosensor and yellow represents inactive biosensor. Figure partially reproduced from original Cancer Res article in reference 7. Scale bar, 30 µm. Columns, mean; bars, SE. **p < 0.01.

