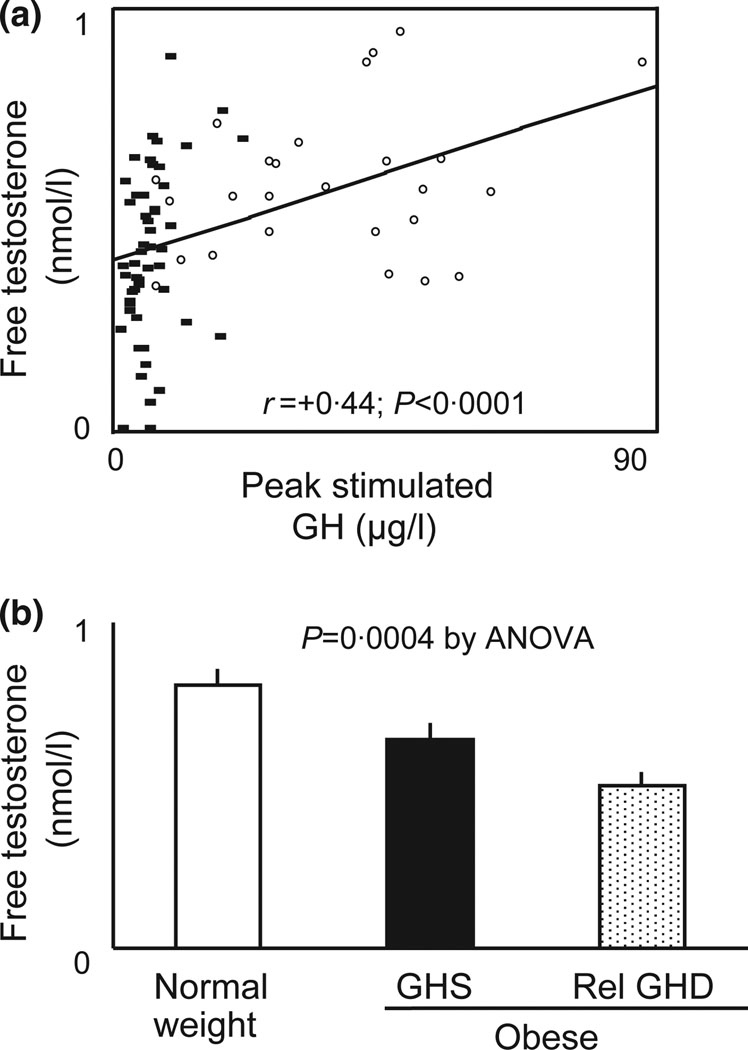
Fig. 1.
(a) Univariate regression analysis of peak growth hormone (GH) on GH-releasing hormone (GHRH)–arginine stimulation test and free testosterone (FT) by equilibrium dialysis. Normal weight subjects are depicted by open circles while obese subjects are depicted by closed squares. (b) FT levels stratified by GH status. GH sufficiency or relative GH deficiency was determined by peak stimulated GH ≤4·2 µg/l on standard GHRH–arginine stimulation test. Statistical significance was determined by anova.

