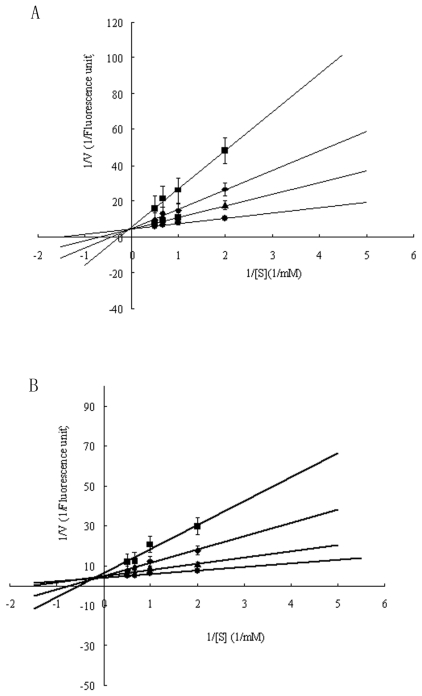
Figure 5.
(A) Different Lineweaver-Burk plots of the purified recombinant Spi1C protein at different concentrations of trypsin substrate at the optimal reaction conditions; (B) Different Lineweaver-Burk plots of the purified recombinant Spi1C protein at different concentrations of α-chymotrypsin substrate with 50 mM Tris-HCl buffer at pH 7.8 and 25 °C. The used different concentrations purified recombinant Spi1C protein were (■) (68.1 nmol/L); (◆) (45.4 nmol/L); (▴) (22.7 nmol/L); and (●) (0 nmol/L), respectively.

