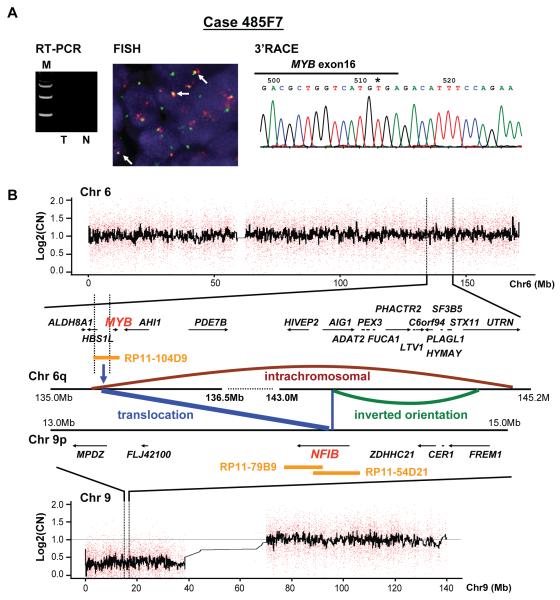
Figure 2.
The chromosomal rearrangements in case 485F7, as an example of genomic MYB-NFIB fusion without transcript formation. A) RT-PCR analysis shows as MYB-NFIB transcript negative (T) and corresponding normal (N). The 3′RACE analysis reveals that the last exon 16 of MYB gene is intact. B) Genomic rearrangement and copy number changes of chromosomes 6 and 9 of the same tumor. The center schematic representation depicts the intra- and inter-chromosomal structures generated from the massively pared-end tag sequencing data. Blue bars, chromosomal rearrangement (MYB-NFIB and NFIB-AIG1); brown bar, intra-chromosomal rearrangement between HBS1L and UTRN gene; green bar, inverted orientation between AIG1 and UTRN gene. Blue vertical arrow indicates NFIB gene breaks at intron 7 that translocates to chromosome 6q22 just proximal to the MYB upstream. MYB probe (RP11-104D9) and NFIB probe (RP11-79B and RP11-54D21) are shown as FISH probes.

