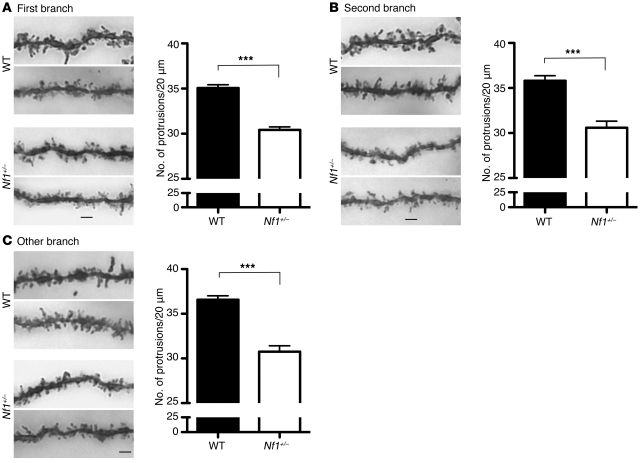
Figure 1. The density of dendritic spines is reduced in Nf1+/– heterozygous mice.
(A) First branches, (B) second branches, and (C) the remaining higher-order branches of apical dendrites of CA1 pyramidal cells. For each group, 2 representative images are shown. The right panels indicate the quantitative results of the spine density. Data represent mean plus SEM. The numbers of analyzed dendrites were (A) WT, 51; Nf1+/–, 55; (B) WT, 21; Nf1+/–, 12; (C) WT, 51; Nf1+/–, 30. Scale bars: 2 μm. ***P < 0.001.

