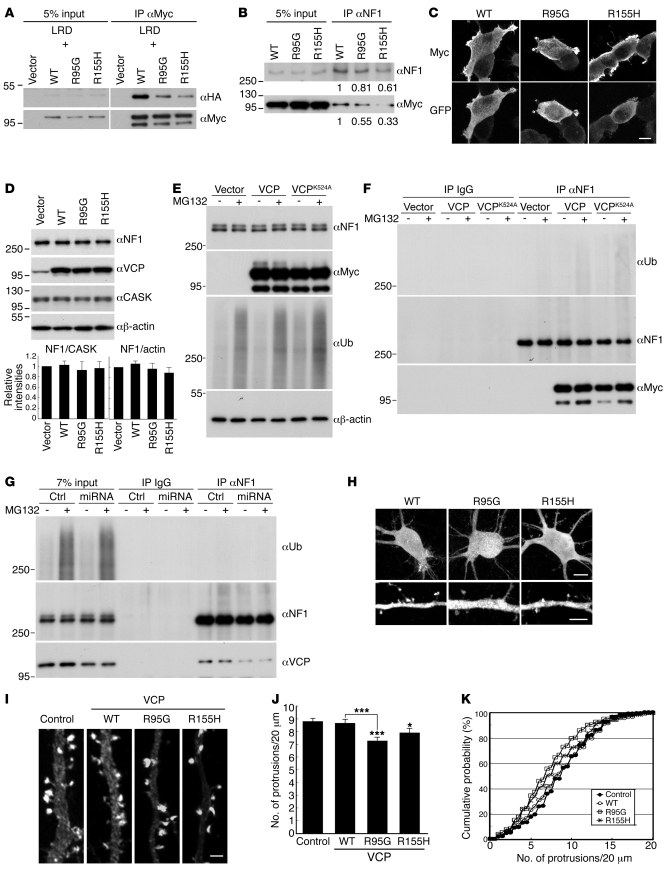
Figure 7. IBMPFD mutations reduce the interaction of neurofibromin and VCP and the density of dendritic spines.
(A) LRD and (B) neurofibromin interact weakly with IBMPFD mutants. Variant Myc-tagged VCP constructs and vector control were cotransfected with HA-tagged LRD or singly transfected into HEK293T cells. One day later, (A) Myc and (B) neurofibromin antibodies were used for immunoprecipitation. Immunoblotting analysis was performed using the antibodies as indicated. The relative intensities to WT lane are shown. Distribution of Myc-tagged VCP and IBMPFD mutants in (C) HEK293T cells and (H) cultured hippocampal neurons was examined by immunostaining using Myc and GFP antibodies. Cotransfection with GFP was performed to outline cell morphology. Expression of (D) IBMPFD mutants, (E and F) VCP K524A mutant, and (G) VCP miRNA construct did not obviously influence the total protein level of neurofibromin. HEK293T cells were transfected with variant VCP constructs, VCP miRNA, or vector control. Immunoblotting was then performed to examine the protein levels of neurofibromin. CASK and/or actin were used as internal controls. In E, F, and G, MG132 was added to cultures 4 hours before harvest or omitted. Ubiquitin antibody FK2 (αUb) was also included in immunoblotting analysis. For F and G, immunoprecipitation was performed using neurofibromin antibody to precipitate endogenous neurofibromin. Immunoblotting using FK2 antibody did not reveal obvious signals in the neurofibromin precipitates. (I) IBMPFD mutants decrease spine density. Cultured hippocampal neurons were cotransfected with GFP-actin and vector control, WT VCP, or IBMPFD mutants (R95G and R155H) at 12 DIV. Cells were fixed at 18 DIV and stained with Myc and GFP antibodies. The morphology of spines was then analyzed based on the GFP signals. (J) Protrusion density. Values are presented as mean plus SEM. (K) Cumulative probability distributions. More than 34 neurons and 146 dendrites for each group collected from 2 independent experiments were analyzed. Scale bars: (C) 10 μm; (H) upper panels, 10 μm; lower panels, 5 μm; (I) 2 μm. In K, P < 0.05, R155H versus control; P < 0.01, R95G versus WT; P < 0.001, R95G versus control. *P < 0.05, ***P < 0.001.

