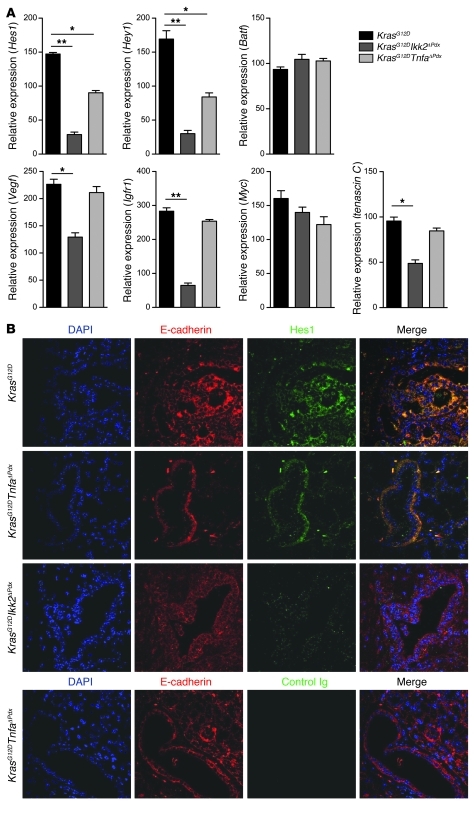
Figure 2. Molecular analysis of Notch and NF-κB target gene expression in KrasG12DTnfaΔPdx and KrasG12DIkk2ΔPdx pancreases.
(A) Relative mRNA expression of Hes1, Hey1, Batf, Vegf, Igfr1, Myc, and tenascin C in KrasG12DTnfaΔPdx and KrasG12DIkk2ΔPdx 3-month PanIN-bearing pancreases was measured by real-time PCR. Data are shown as mean + SD; n = 6. *P < 0.05, **P < 0.01. The experiment was done in duplicate. (B) Immunofluorescence staining for Hes1 and E-cadherin in PanIN-bearing pancreases from KrasG12DTnfaΔPdx, KrasG12DIkk2ΔPdx, and KrasG12D mice at 3 months of age. Original magnification, ×40. Blue, DAPI; red, E-cadherin; green, Hes1.

