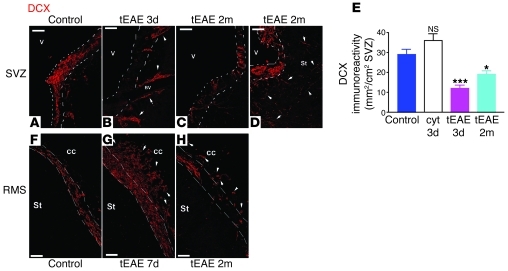
Figure 3. Reduction in neuroblast chains in the tEAE SVZ.
(A) Numerous DCX+ cells are present in the control subependymal area. (B) SVZ areas free of DCX+ cells with chains emigrating into the neighboring striatum (arrowheads) along the blood vessels in tEAE tissue 3 days p.i. (C and D) SVZ in tEAE mice sacrificed 2 months p.i. (C) Areas containing few DCX+ cells alter with those containing bulks of DCX+ cells as shown in D. Arrowheads in D show individual DCX+ cells in the striatum near the SVZ. SVZ limits are indicated by white dashed lines. (E) Quantification of DCX immunoreactivity in the SVZ (n = 3–6 mice/group). Decreases compared with the controls are significant in tEAE mice at 3 days and 2 months p.i. (***P = 0.0002 and **P = 0.0087, respectively), but no significant changes in the amount of DCX were observed in non-immunized mice sacrificed 3 days following cytokine injection as compared with the controls. Error bars represent SEM. (f–h) RMS in control versus tEAE mice. (F) Organized chain migration toward OB in control RMS. (G) Accumulation of DCX+ cells within the RMS region proximal to the SVZ and emigration into the corpus callosum at 7 days p.i. (arrowheads). (H) Interruptions of the RMS and individual DCX+ cells in tEAE corpus callosum, 2 months p.i. (arrowheads). Scale bars: 50 μm.

