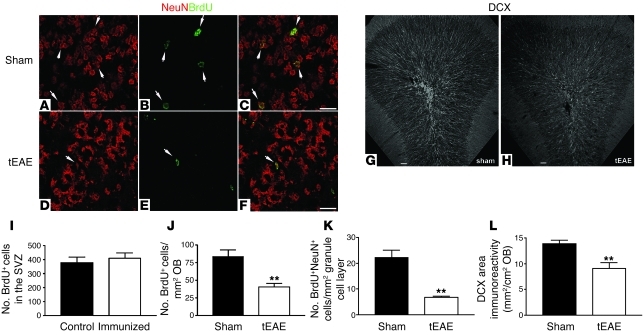
Figure 6. OB neurogenesis decreases during tEAE.
Tracing of SVZ progeny was performed by two 2-hour BrdU pulses prior to pathology induction. (A–F) Representative images of granule cell layer in the OBs of sham-treated (A–C) and tEAE mice (D–F) sacrificed 2 weeks following pathology induction and BrdU injections. (I) BrdU labeling efficiency of SVZ cells is identical for sham-treated and tEAE mice immediately after the pulse. (J) Two weeks p.i., fewer (**P = 0.0037; n = 4–5 mice/group) BrdU+ cells are found in the OB of tEAE compared with sham-treated mice. (K) In the granule cell layer, a decrease (**P = 0.0006; n = 4–5 mice/group) in newly formed mature neurons (BrdU+NeuN+) is observed. (G, H, and L) Long-term evaluation of granule cell neurogenesis was performed by quantification of DCX+ immature neurons. (G and H) Representative images of coronal OB sections labeled with DCX antibody in sham-treated (G) and tEAE (H) mice sacrificed 3 months p.i. (L) Quantification of DCX immunoreactivity (**P = 0.0029; n = 6–7 mice/group). Error bars represent SEM. Scale bars: 20 μm (a–f), 50 μm (G and H).

