Figure 2.
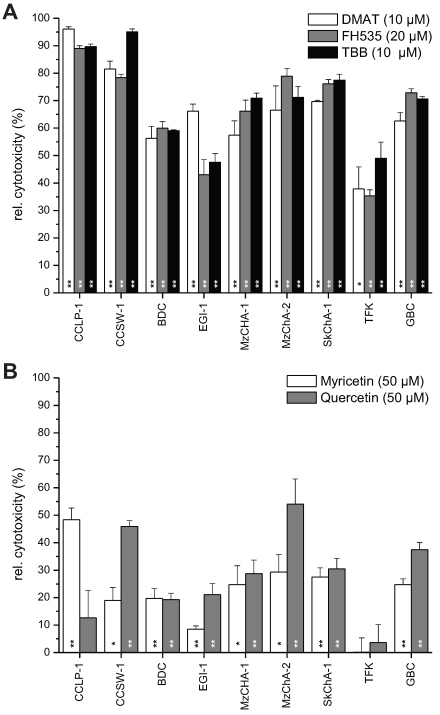
Overall cell line-dependent cytotoxicity. Nine different biliary tract cancer cell lines were incubated with a single concentration of DMAT, FH535, TBB (A) or myricetin, quercetin (B) as indicated in the diagram in serum-free DMEM for 72 hrs at 37° C. Afterwards, the resazurin assay was used to determine the cytotoxic effect (i.e. loss of viability) compared to untreated controls for each cell line (set to 0% toxicity). Significant (p<0.05) and highly significant (p<0.01) differences between the viability of treated cells and the untreated controls for each cell line are marked with * and **, respectively (paired t-test). For better visualisation of the cytotoxic effect of each drug, values are given as relative cytotoxicity (control cells = 0%, i.e. 100% viability).

