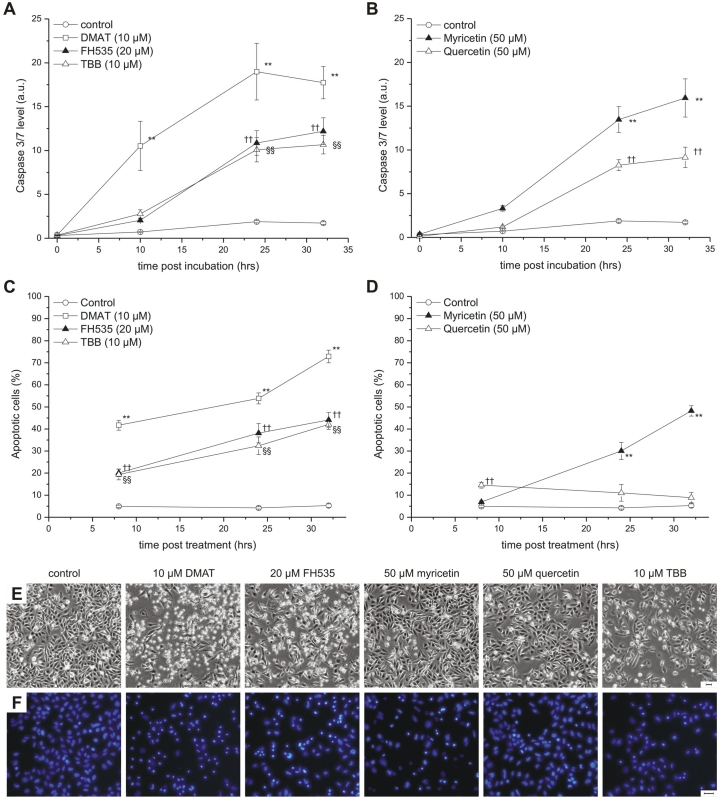
Figure 4.
Apoptosis induction. CCLP-1 cells were incubated with 10 µM DMAT, 20 µM FH535, 10 µM TBB (A, C) or 50 µM myricetin, 50 µM quercetin (B, D) in serum-free DMEM and incubated for different periods. Caspase activity (A, B) was measured using a luminometric Caspase 3/7 assay as an indicator of apoptosis execution and related to the total protein content (a.u., arbitrary units). Nuclear fragmentation indicative of the late steps in the apoptotic process (C, D) was measured via fluorescence microscopy by Hoechst 33342 nuclear staining. Condensed and fragmented nuclei were counted as apoptotic cells. Representative phase contrast and Hoechst fluorescence microscopy images taken at 24 hrs after incubation are shown in E and F, respectively (scale bars indicate 50 µm). Significant (p<0.05) and highly significant (p<0.01) differences between signals (caspase signal or fractions of apoptotic nuclei) of treated cells and the untreated controls for each time point are marked with *, †, § and **, ††, §§ respectively (univariate ANOVA, LSD post-hoc test).

