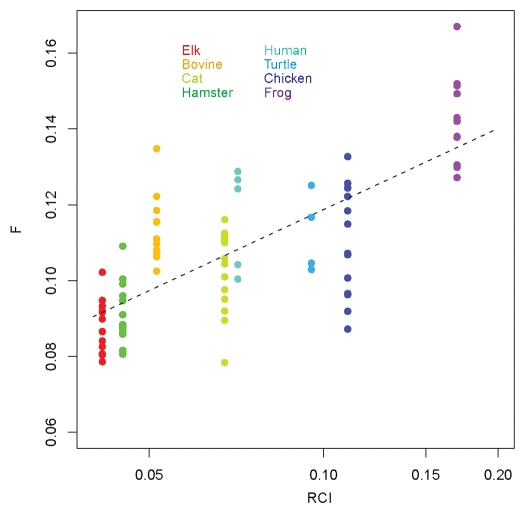
Figure 11.
Summary of the flexibilities at the loop S2-HB in various species. Shown are the maximum flexibilities in the region of the loop, as derived from the RCI profiles and the computed flexibility profiles. The points indicate the data from different segments, and the dashed line represents a root mean square fit. Note that for RCI, a logarithmic scale is employed.

