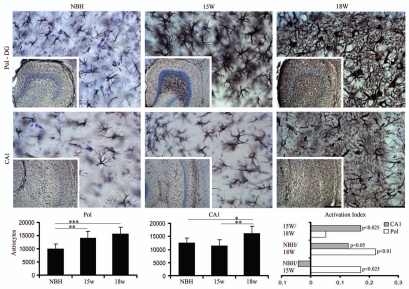
Figure 4.
Top and bottom: low and high power photomicrographics of the polymorphic layer of dentate gyrus (PolDG) and CA1 of GFAP immunostained sections after 15 or 18 w.p.i. Graphic representations illustrate the mean values and error bars of the total number of astrocytes in the PolDG (left) and CA1 (middle) and of the activation index (right) of reactive astrocytes in CA1 and polymorphic layer. Activation index was estimated by the following equation AI18/NBH = (ME718w − NBH)/(ME718w + NBH) or AI18/15 = (ME718w − ME715w)/(ME718w + ME7 15w) or AI15/NBH = (ME715w − NBH)/(ME715w + NBH) where AI is the activation index in the period and ME718w, ME715w and NBH are the estimates of the number of objects of interest at 15 and 18 w.p.i. in each region for each experimental group. Significant differences are indicated by (*) and the probability values by p level; (*) = 0.05; (**) = 0.025; (***) = 0.01. Scale bars: Scale bars: low power 250 µm; high power 25 µm.

