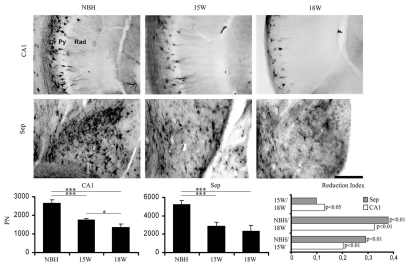
Figure 7.
Top and middle: low and high power photomicrographs of CA1 and septum of sections stained for biotinylated Wisteria floribunda to demonstrate perineuronal nets after 15 or 18 w.p.i. of infected (15 w, 18 w) or normal brain (NBH) homogenates. Bottom: graphic representations of the mean and error bars estimations of the total number of perineuronal nets in CA1 (left) and septum (middle) and of the reduction index (right) of perineuronal nets in CA1 (white bars) and septum (grey bars). Reduction index was estimated by the following equation RINBH/18 = (ME718w − NBH)/(ME718w + NBH) or RI15/18 = (ME715w − ME718w)/(ME715w + ME7 18w) or RINBH/15 = (ME7NBH − ME715w)/(NBH + ME715w) where RI is the reduction index in the period and ME718w, ME715w and NBH are the estimations of the number of objects of interest at 15 and 18 w.p.i. of ME7 infected or normal brain (NBH) homogenates in each region for each experimental group. Significant differences are indicated by *p < 0.05 or **p < 0.01.

