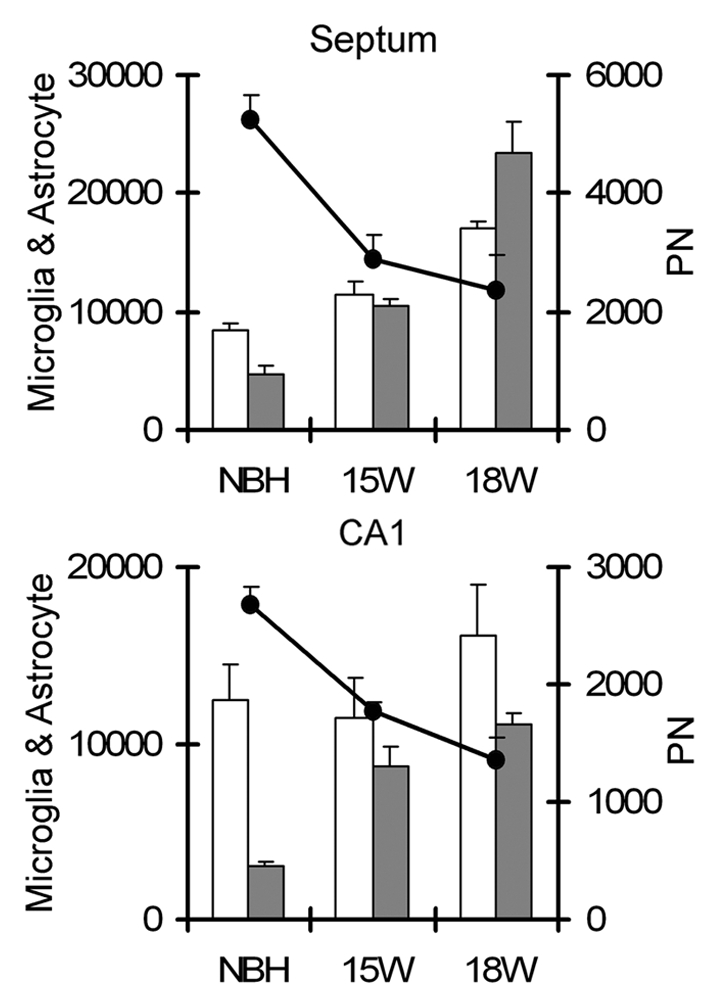
Figure 8.

Overview of the total numbers of astrocytes, microglia and PN nets estimations in the septum (top) and CA1 (bottom). Note that the total number of perineuronal nets (PN) decrease along the disease progression whereas astrocytes and microglia increase. White and black columns correspond to astrocytes and microglia respectively whereas data points correspond to PN nets estimations.
