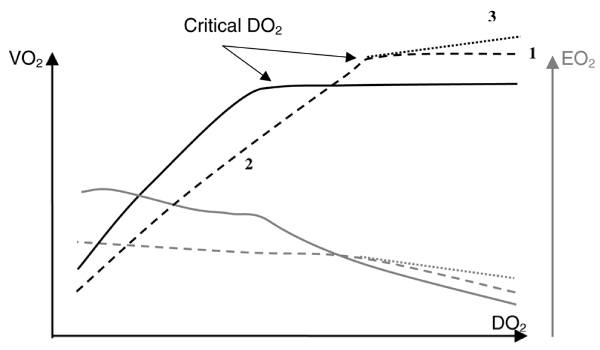
Figure 1.

Pathophysiological changes in the VO2/DO2 relationship. Normal relationship is shown in a solid black line, and abnormal relationships in dotted lines. 1: Increased VO2 needs; 2: impaired EO2; 3: other mechanisms (see text). The grey curves are the corresponding EO2/DO2 relationships. DO2, oxygen delivery; EO2, oxygen extraction ratio; VO2, oxygen consumption. Reproduced with permission from Squara [4].
