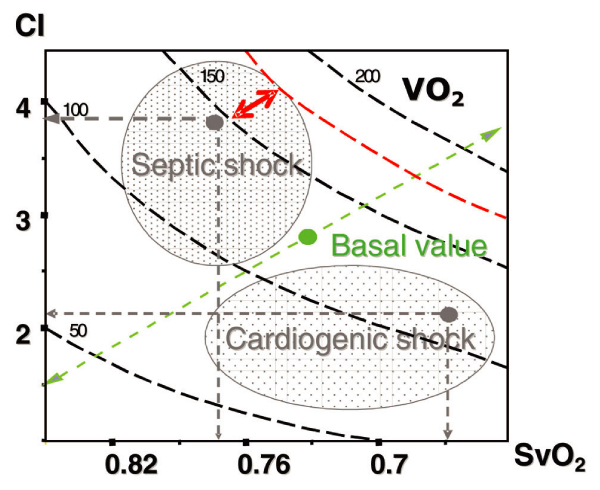
Figure 3.

Nomogram showing CI, SvO2 and VO2 isopleths (dotted black lines). The green point shows the expected values for a 59-year-old woman at basal metabolism, and the green dotted arrow indicates the expected normal variations in case of hypo- or hypermetabolism. The real position of the patient in the nomogram can be continuously monitored. This is adequate for diagnostic purposes. The patient's position can move from the normal profile to a characterized area of septic or cardiogenic shock (grey dotted arrows and areas). However, for therapeutic objectives, this nomogram gives no idea of needs. If we made the hypothesis that the nVO2 (red isopleth) is higher than the oVO2, then the red double arrow indicates the difference between nVO2 and oVO2. Units for CI are l/min per m2 and for VO2 they are ml/min per m2. CI, cardiac index; (n/o)VO2, (needed/observed) oxygen consumption; SvO2, mixed venous oxygen saturation.
