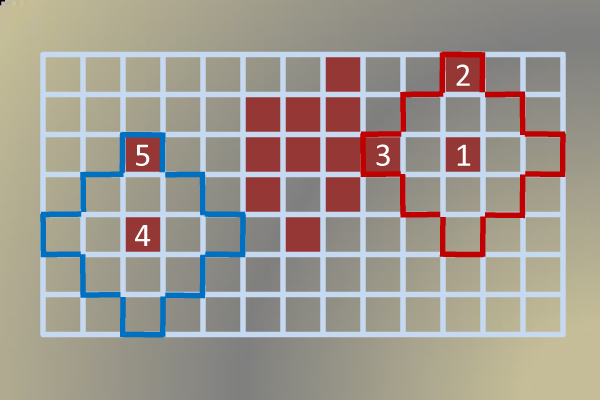
Figure 5.
A toy example depicting notion of DBSCAN clustering algorithm, with ε = 2 and MinPxl = 3. Maroon pixels represent data points in search space (grid, or image). A neighborhood search fired at point 1 encloses the region drawn in red. This region has three points (1, 2, and 3) that is equal to or greater than MinPxl. Therefore, we expand the main body of cluster (a tight group of maroon points) to have points 1, 2, and 3. On the other hand, query for point 4, drawn in blue, has only two points that does not meet MinPxl. As a result, point 4 and 5 can neither form a new cluster nor merge an existing cluster. They will be reported to be outliers at the end.

