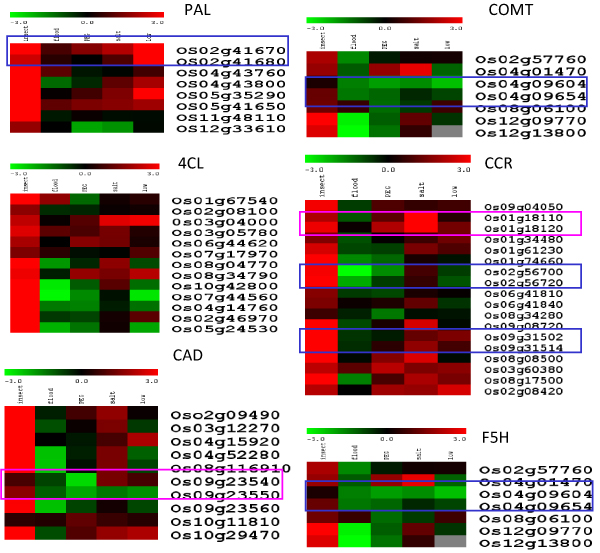
Figure 6.

Cluster analysis of lignin biosynthesis genes under different treatments. The logarithm 2 transformed ratios were used, and the color schema is as shown in the figure. The gene ID is shown on the right and the different treatments including insect, flood, salt, PEG (for osmotic stress), and low temperature are labeled. The blue box indicates that the paralog genes share a similar gene expression pattern (possible RR mode), while the pink box indicates that the paralog genes have evolved different gene expression patterns (possible RN mode).
