Figure 1.
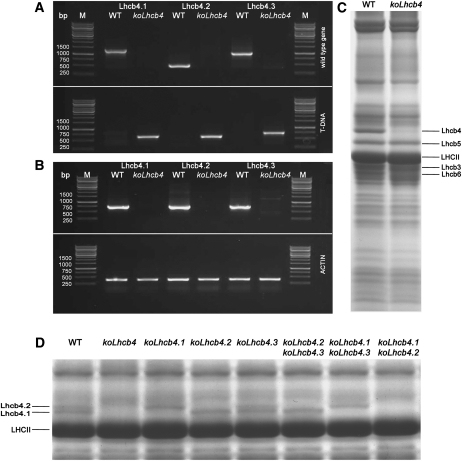
Genetic and Biochemical Characterization of the koLhcb4 Mutant (Triple Mutant for the Three Isoforms of Lhcb4).
(A) Amplification of Lhcb4.1, Lhcb4.2, and Lhcb4.3 loci with allele-specific PCR primers. Top panel: amplification using gene-specific primers. Bands of 1378, 520, and 1046 bp were obtained for the amplification of the Lhcb4.1, Lhcb4.2, and Lhcb4.3 loci, respectively. Bottom panel: amplification using T-DNA–specific primers. Bands of 685, 661, and 773 bp were obtained for the amplification of Lhcb4.1, Lhcb4.2, and Lhcb4.3 KO loci, respectively. Details of primer sequences are reported in Methods. WT, wild type.
(B) RT-PCR measurement of gene-specific transcripts. Sequences of the oligonucleotides used are reported in Methods. Top panel: for each gene, RNA extracted from the wild type and the corresponding mutant was subjected to reverse transcription, followed by 30 cycles of PCR amplification. Bottom panel: amplification of the housekeeping gene actin2 transcript from the same RNAs used as loading control. M, molecular weight marker. The expected sizes of the PCR products are as follows: Lhcb4.1, 724 bp; Lhcb4.2, 715 bp; Lhcb4.3, 730 bp; and actin, 384 bp. Each RT-PCR measurement was repeated three times.
(C) SDS-PAGE analysis of wild-type and koLhcb4 mutant thylakoid proteins performed with the Tris-Tricine buffer system (Schägger and von Jagow, 1987). Selected apoprotein bands are marked. Purified thylakoid sample, corresponding to 15 μg of chlorophylls, was loaded in each lane.
(D) SDS-PAGE analysis performed with the Tris-Tricine buffer system with the addition of 7 M urea to the running gel in order to separate Lhcb4 isoforms in the Lhcb4 KO mutants. Selected apoprotein bands are marked. Fifteen micrograms of chlorophylls were loaded in each lane.

