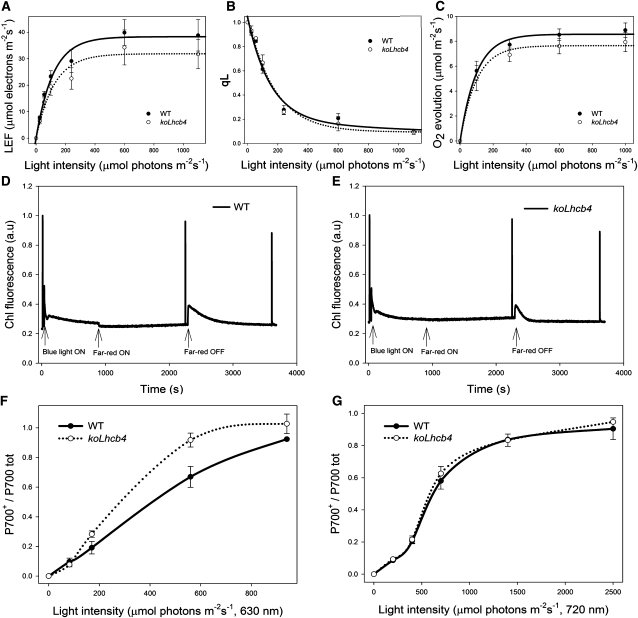
Figure 3.
Characterization of Photosynthetic Electron Flow in Wild-Type and koLhcb4 Plants.
(A) Dependence of the LEF rate on light intensity in wild-type (WT) and koLhcb4 leaves. LEF rate is calculated as ϕPSIIPSII·PAR·Aleaf·fractionPSII (see Methods for details).
(B) Photosynthetic oxygen evolution in saturating CO2. Rate of oxygen evolution was measured on whole leaves during illumination with various levels of actinic red light.
(C) Amplitude of qL measured at different light intensities on wild-type and koLhcb4 leaves. qL reflects the redox state of the primary electron acceptor QA, thus, the fraction of open PSII centers.
(D) and (E) Measurement of state I–state II transition in the wild type (D) and koLhcb4 (E). Upon 1-h dark adaptation, plants were illuminated with blue light (40 μmol photons m−2 s−1, wavelength <500 nm) for 15 min to reach state II. A far-red light source was then superimposed on the blue light to induce a transition to state I. Values of Fm, Fm′, and Fm′′ were determined using light saturation pulses (4500 μmol photons m−2 s−1, 0.6 s). a.u., arbitrary units.
(F) and (G) Dependence of the P700 oxidation ratio (ΔA/ΔAmax) on light intensity. ΔA/ΔAmax was measured on wild-type and koLhcb4 leaves at varying actinic intensities, exciting either PSII + PSI (λ = 630 nm; [F]) or PSI only (λ = 730 nm; [G]).

