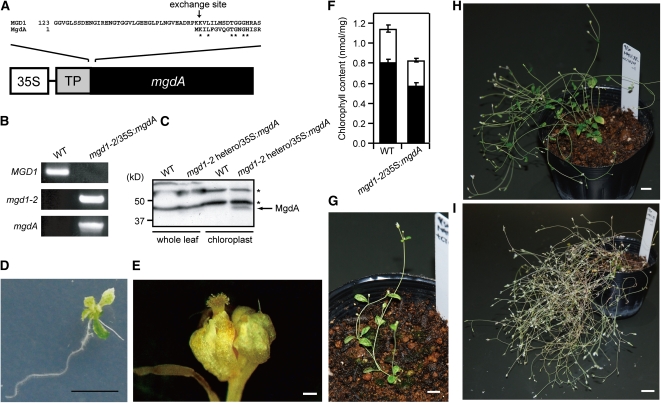
Figure 5.
Phenotypes of mgd1-2/35S:mgdA Complementing Plants.
(A) Schematic representation of the DNA construct for producing the recombinant plants. The exchange site between MGD1 transit peptide and MgdA is indicated by an arrow.
(B) PCR analysis of genomic DNA from a wild-type and mgd1-2/35S:mgdA transgenic plant. Amplified bands were specific for MGD1, mgd1-2, and the mgdA locus.
(C) Immunoblot analysis with MgdA antibody. Whole-leaf extracts and chloroplast-enriched fractions were obtained from the wild type and the mgd1-2 heterozygous mutant harboring the 35S:mgdA construct. Asterisks indicate nonspecific bands.
(D) Seedling stage 21 d of a mgd1-2/35S:mgdA transgenic plant. Bar = 1 cm.
(E) A flower bud of the mgd1-2/35S:mgdA transgenic plant. Bar = 1 mm.
(F) Chlorophyll content of wild-type and mgd1-2/35S:mgdA transgenic plants. White and black bars are for chlorophyll b and chlorophyll a, respectively. The values are the means ± sd of three biological replicates.
(G) A 35-d-old mgd1-2/35S:mgdA transgenic plant. Bar = 1 cm.
(H) A 56-d-old mgd1-2/35S:mgdA transgenic plant. Bar = 1 cm.
(I) A 99-d-old mgd1-2/35S:mgdA transgenic plant. Bar = 2 cm.

