Figure 2.
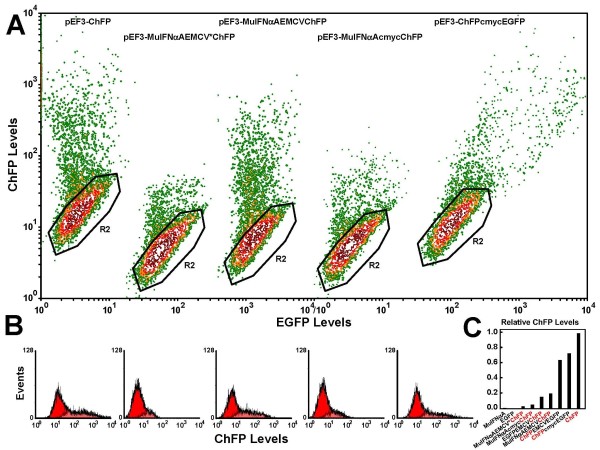
Translation of cistrons from pEF3-based plasmids. (a) 293T cells were transfected using polyethyleneimine (PEI) with the following plasmids (from left to right): pEF3-ChFP, pEF3-MuIFNαAEMCV*ChFP, pEF3-MuIFNαAEMCVChFP, pEF3-MuIFNαAcmycChFP, and pEF3-ChFPcmycEGFP. The monomeric cherry fluorescent protein (ChFP)-expressing cells were resolved from nonfluorescent cells (isolated by the black gate labeled R2) by a contoured dotplot of FL1 (EGFP levels, horizontal) versus FL3 (ChFP levels, vertical) fluorescence. (b) Histograms of FL3 fluorescence of the ungated population (red) and the inversely-gated population indicating the ChFP-positive cells (light red, overlaid) are placed under the respective contour plots. (c) Comparison of ChFP translation rates. The mean red fluorescence of the inversely gated cells are shown for cells transfected with the following plasmids (from left to right): no ChFP cistron (pEF3-MuIFNαA, pEF3-EGFP), ChFP as the second cistron (pEF3-MuIFNαAEMCV*ChFP, MuIFNαAcmycChFP, pEF3-MuIFNαAEMCVChFP, pEF3-EGFPEMCVChFP), ChFP as the first cistron (pEF3-ChFPEMCVEGFP, pEF3-ChFPcmycEGFP), and ChFP as the only cistron (pEF3-ChFP).

