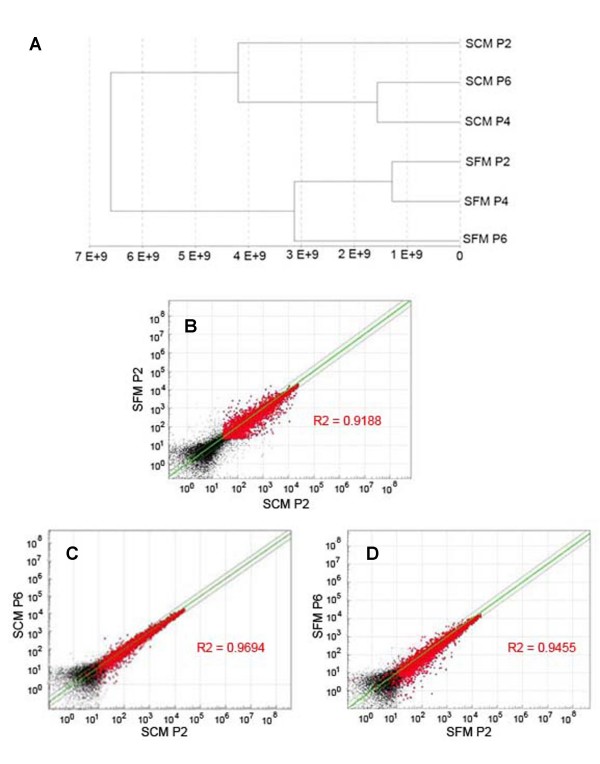
Figure 5.
Transcriptome comparison of MSCs cultured in serum-free and serum-containing media. (a) Dendrogram showing the relatedness of cells based on global gene expression obtained by using Illumina bead array and analyzed by using Bead Studio. (b-d) Pairwise comparison of global gene-expression profiles of MSCs maintained in SCM and SFM. Data points >0.99 detection limit are represented in red. Points lying outside the green line represent genes with greater than twofold difference, whereas R2 values closer to 1 suggest similarity in global gene expression. (b) Human MSCs in SCM and SFM after passage 2 (P2). (c) Comparison of cells grown for two passages (P2) versus cells grown for six passages (P6) in SCM. (d) Comparison of cells grown for two passages (P2) versus cells grown for six passages (P6) in SFM.

