Figure 2.
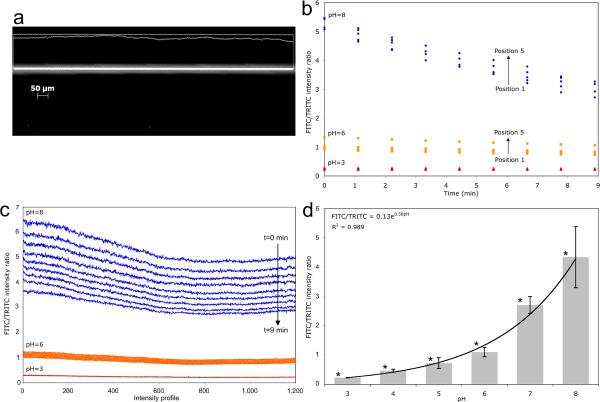
Calibration controls for pH dependent FITC/TRITC emissions ratios at 535±40 nm and 640±25 nm, respectively. a) 535±40 nm (FITC filtered) microscope image of a 20 ⎧m diameter capillary. Intensity values were measured along the capillary centerline (intensity profile is projected above). Separate FITC and TRITC images were taken at each position every ~1.1 minutes for 9 minutes. Three independent experiments were conducted (n=3). b) FITC/TRITC intensity ratios were calculated according to Eq (3) on a pixel by pixel basis. FITC/TRITC profiles for each position were averaged and are shown for pH 3, pH 6, and pH 8. c) To ascertain time dependence, FITC/TRITC profiles from the same position were averaged. The compiled profiles are shown at each time from 1 min to 9 min at pH 3, 6 and 8. d) Intensity profiles were averaged over pixels, time and position, then used to calculate a FITC/TRITC ratio for pH values 3 through 8. 95% confidence intervals with asterisks indicate no overlap between adjacent pH controls.

