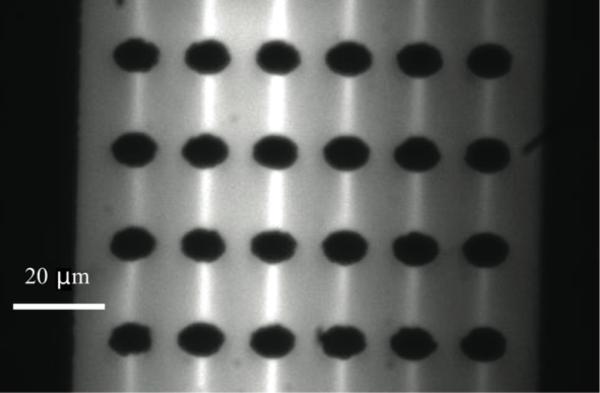
Figure 3.
Fluorescence microscopy image obtained during iDEP manipulation of IgG in an array of elliptic posts. The light areas correspond to regions where the concentration of IgG was increased due to positive DEP. The applied electric field strength was 2400 V/cm. The IgG concentration was 1.7 nM, buffer pH was 8 and conductivity was 0.04 S/m.

