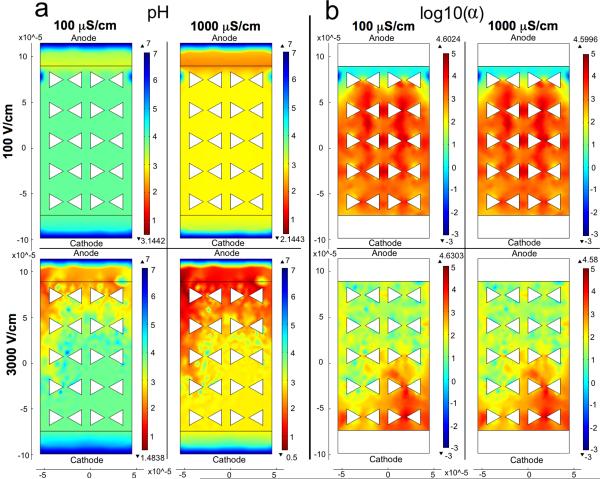
Figure 5.
Comparison of pH and log10(α) values plotted for different electric field strengths and conductivities. α is the ratio of the electrophoretic flux to the diffusion flux as defined in Eq. 9. The anode is at the top of the plots. The flux terms representing the H+ and OH− carrying currents were defined at the interior boundaries, and the boundaries beyond those are set to concentrations of 10−7 M for both species. Simulation conditions are outlined in Table SI1. a) pH values plotted by COMSOL confirm experimentally observed trends of higher electric field strengths resulting in larger pH drops. However, COMSOL does not account for buffering strength and so conductivity dependence is not comparable between experiments and these COMSOL results. b) Order of magnitude differences between the electrophoretic and diffusional fluxes are shown with larger values indicating more dominant electrophoretic migration.

